Sklearn 笔记
安装
1 | # pip 安装 |
模型优化
分类器
随机森林
1 | from sklearn.ensemble import RandomForestClassifier |
随机梯度
1 | from sklearn.linear_model import SGDClassifier |
误差分析
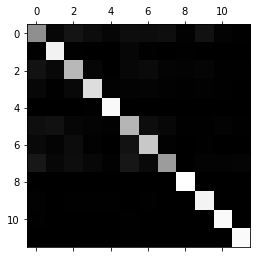
混淆矩阵
1 | from sklearn.model_selection import cross_val_predict |
查看结果
1 | # 画图 |
有时候我们仅关注误差数据图像呈现。
1 | row_sums = conf_mx.sum(axis=1, keepdims=True) |
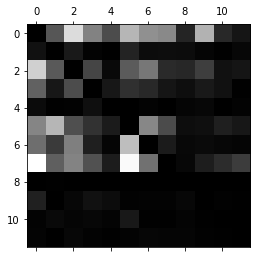
说明下,这里行代表实际类别,列代表预测的类别。颜色越亮说明分错概率越高。